Baseline correction
This tool calculates background signal baselines and subtracts them from the raw signal.
Baseline interpolation regions (BIRs, grey bars in the plots) are used to calculate baselines with the baselineCorrect() method
from ramCOH. Exact BIR positions are shown in the settings bar, with numbered BIRs in rows and their start and end coordinates in columns.
With the + and - buttons next to the coordinates, BIRs can be added or removed, where new BIRs are placed to the right of the one where the button was pressed.

baseline settings.

Removing and adding BIRs.
BIR positions
Note
Default BIRs can be changed, see settings.
By default SilicH2O uses five BIRs: one at the end and start of the spectrum, one in between the silicate and H2O regions and two intermediate in the silicate region.
Their positions can be adjusted for each sample in two ways:
by typing exact values in the settings bar.
by clicking and dragging directly in the plot.
In the settings bar, boundary positions are changed by typing a new value in one of the cells and confirming by pressing the Enter key.
In the plot, BIR boundaries are moved by clicking and dragging them left or right:

Moving BIR boundary positions.
By clicking and dragging from inside a BIR the entire BIR can be moved around:

Moving BIR positions.
Baseline correction settings (BIR positions and smoothing settings) can be copied with the keyboard shortcut Ctrl+q and applied to a different sample by pasting with Ctrl+w
Baseline smoothing
Baseline smoothing is adjusted via the smoothing parameter in the settings bar, with values between 0 and 100. At values close to zero the baseline will be linear, while at high values it will closely follow
the datapoints in the BIRs
Default smoothing is set to 1.0, which generally works well for silicate glasses.
Smoothing values are passed to the the smooth_factor parameter of the baselineCorrect() method.
Results
Baseline corrections produce two types of results:
signal-to-noise ratios, calculated with
calculate_SNR()integrated peak areas, calculated with
calculate_SiH2Oareas()
both are updated in the results bar in real-time as parameters are adjusted:

baseline correction results.
Signal strength is calculated separately for silicate and H2O, as the maximum baseline corrected intensity within each region. Noise is calculated from datapoints within the BIRs as two standard deviations on the baseline corrected signal. Keep in mind that this only produces realistic noise values if these regions are free from peaks.
Peak areas are calculated for the silicate and H2O regions, with boundaries from _get_Si_H2O_regions().
If a calibration is linked to the active project, sample H2O contents are shown in the bottom right corner.
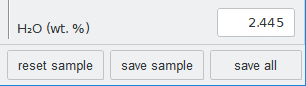
calculated H2O contents.